The Journey to Traefik Enterprise Edition: Product Evaluation
Welcome to the second post of our journey towards Traefik Enterprise Edition .
After our first step (Join the“Early Access” Program), let’s continue by doing a quick evaluation the product on your local machine.
(A voice in the background): But, the shiny website says that it is a distributed version. How can we assess this on a single machine?
(Another voice in the background): A developer machine is not a production environment!
Containous: These assertions are 100% right dear users! Following the core principles of Traefik, we want to keep things simple and start by getting TraefikEE up and running on a “testing system”. Don’t worry: next steps of the journey are coming, to cover other topics from high availability, to installation on production systems.
TraefikEE Installation
The next step of the journey is to install TraefikEE: Let’s follow the provided documentation!
“TraefikEE-Cuddle”
The “Getting Started with Installation” page recommends to use the command line traefikeectl and guides you on installing this command:
$ curl -sSL -o /usr/local/bin/traefikeectl https://get-the-link-for-your-operating-system/traefikeectl

$ shasum -a256 /usr/local/bin/traefikeectl # Check against the SHA256 checksums for your release

$ chmod a+x /usr/local/bin/traefikeectl # Make it executable

$ traefikeectl version
Version:      v1.0.0-beta16
Codename:     Gewurztraminer
Go version:   go1.11.4
Built:        2019-01-21_06:00:54PM
OS/Arch:      darwin/amd64
Kubernetes Time!
TraefikEE can be installed on different platforms but, this example uses Kubernetes.
(A voice in the background): I don’t know Kubernetes
Containous: You don’t have to for this evaluation. But you can learn it from https://kubernetes.io/docs/tutorials/kubernetes-basics/
A Kubernetes installation is required. Don’t worry, we are not yak shaving to select where and how install Kubernetes.
Instead we’ll use the awesome “KinD” (Kubernetes inside Docker) tool providing a disposable Kubernetes locally.
(From https://github.com/kubernetes-sigs/kind),kindis a tool for running local Kubernetes clusters using Docker container "nodes".kindis primarily designed for testing Kubernetes 1.11+, initially targeting the conformance tests. If you have Go and Docker installedgo get sigs.k8s.io/kind && kind create clusteris all you need
Install your Kubernetes cluster for the evaluation:
$ kind create cluster --name=traefikee
Creating cluster 'kind-traefikee' ...
✓ Ensuring node image (kindest/node:v1.12.3) 🖼
✓ [kind-traefikee-control-plane] Creating node container 📦
✓ [kind-traefikee-control-plane] Fixing mounts 🗻
✓ [kind-traefikee-control-plane] Starting systemd 🖥
✓ [kind-traefikee-control-plane] Waiting for docker to be ready 🐋
✓ [kind-traefikee-control-plane] Starting Kubernetes (this may take a minute) ☸

Cluster creation complete. You can now use the cluster with:
export KUBECONFIG="$(kind get kubeconfig-path --name="traefikee")"
kubectl cluster-info

$ export KUBECONFIG="$(kind get kubeconfig-path --name="traefikee")"

$ kubectl cluster-info
Kubernetes master is running at https://localhost:55243

# We have a Kubernetes cluster ready to use!
Please note that any local Kubernetes installation passing the conformance tests can be used for the evaluation (as Docker4Mac or Docker4Windows).
TrafikEE Installation
Following the official documentation, you may install TraefikEE in one line, using traefikeectl . It might take a few minute to download all the required resources:
$ traefikeectl install \
  --licensekey="$(cat /keybase/.../traefikee-license)" \
  --dashboard \
  --kubernetes
...

You can access the dashboard with the following credentials:

Username: admin
Password: 4087abf2354666d9

✔ Installation successful
Congratulations, your TraefikEE cluster is installed locally!
A Tour of TraefikEE
TraefikEE is installed, now what?
First, we have to open access from your web-browser to the cluster:
# Forward TraefikEE data plane's port 80 to your localhost:8000
kubectl port-forward -n traefikee "$(kubectl get pod -n traefikee | awk '{print $1}' | grep data-node)" 8000:80 &
TraefikEE is now exposed on your machine on the following URL: http://localhost:8000 .
On a production-grade Kubernetes installation, you would use your external Load Balancer’s public hostname and port.
Web Dashboard
Let’s start the tour with the Web Dashboard, which is enabled because we used the flag--dashboard during the installation.
Open the URL http://localhost:8000 and authenticate with the username and password credentials from the traefikeectl install command’s output from earlier.
In this example, the username isadminand the password isd4087abf2354666d9dsds. These credentials are generated automatically during the installation.
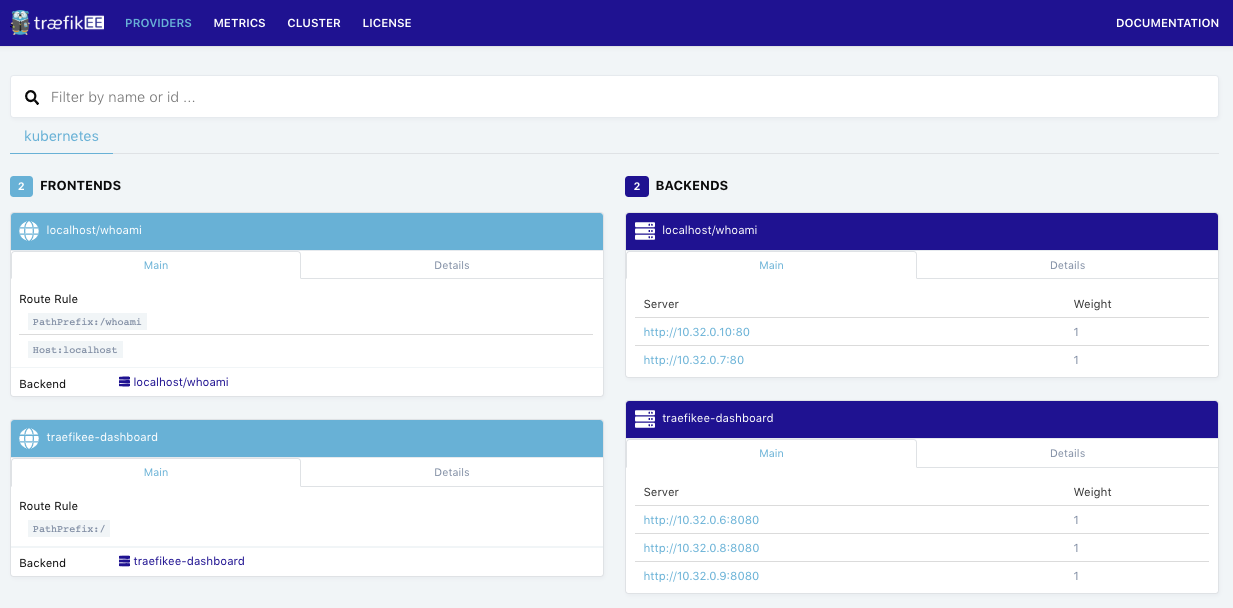
You can see the default section named “Providers” which shows you the TraefikEE’s routing configuration, generated from Kubernetes:

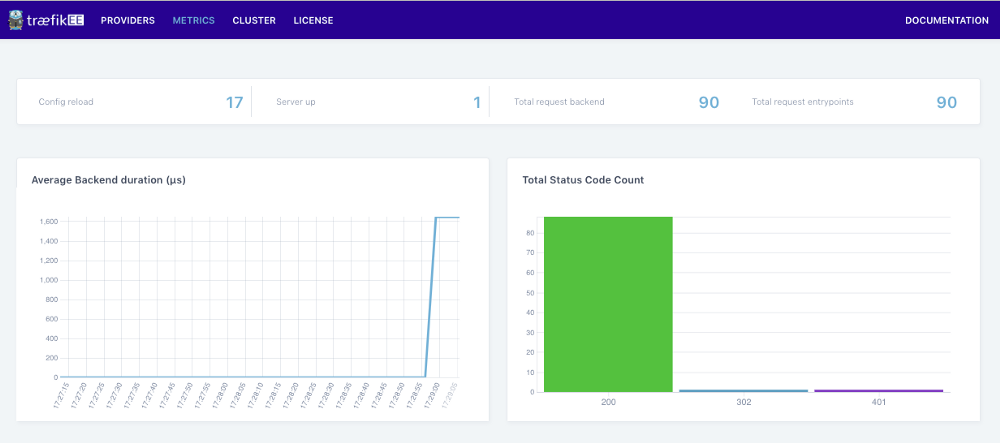
Using the top bar, navigate to the “Metrics” section to get an overview of the incoming request’s metrics.
(A voice in the background): Traefik also provides a “Metrics” page, what is the value of this one?
Containous: It’s the same, except that metrics are aggregated from all the data plane’s nodes.
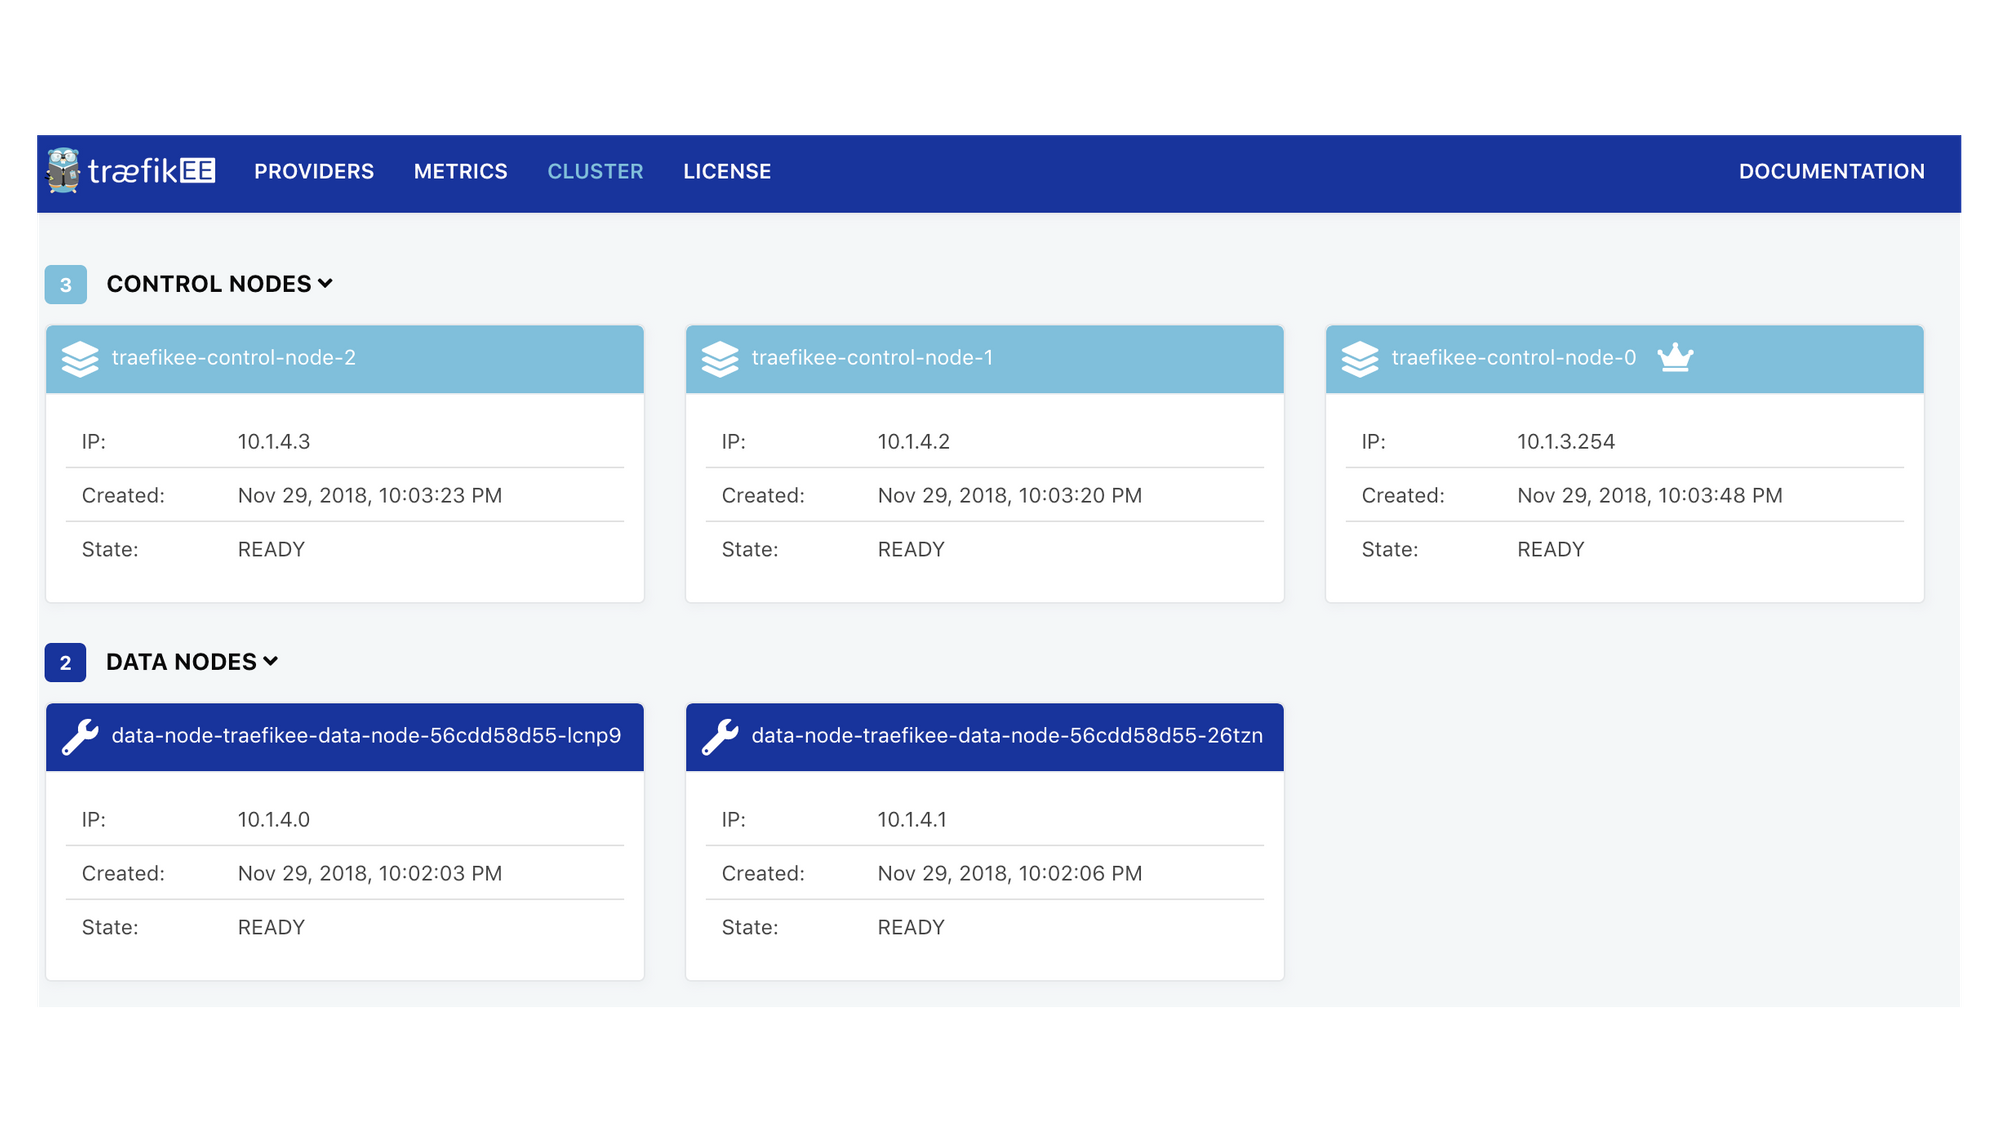
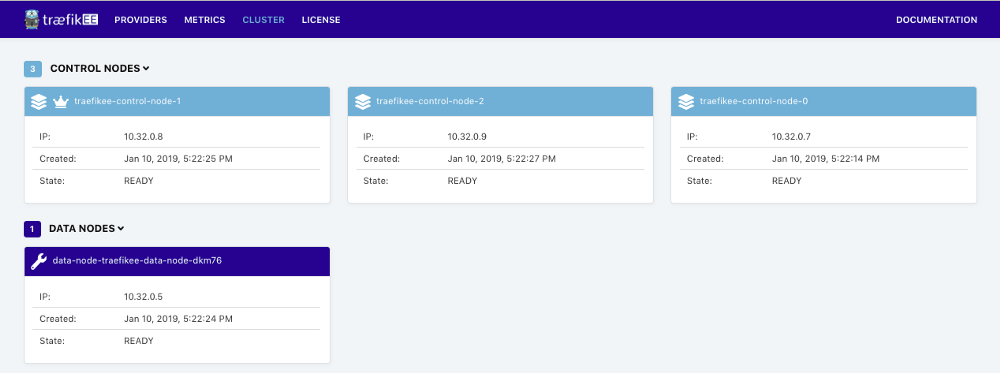
It’s time to get an overview of the cluster. Browse to the “Cluster” section to check that you have a Control Plane of 3 nodes, and a Data Plane of 1 node.
(A voice in the background): Wait, isn’t TraefikEE distributed? Why only 1 node in the data plane?
Containous: By default, there is 1 “TraefikEE Data Node” per Kubernetes node. We are using a single-node Kubernetes hence 1 data node. Wait for the next blog to learn more about the distribution.
Operations with traefikeectl
Next step of this tour is the “Smooth Operations” feature. We know that Engineers love automation. So we made a command line, traefikeectlto automate all the operations on your TraefikEE clusters.
You already tasted traefikeectl. Let’s do another example of operation by listing all the cluster’s nodes with traefikeectl:
$ traefikeectl list-nodes

Name                                 Role
----                                 ----
data-node-traefikee-data-node-5fplw  DATA NODE
traefikee-control-node-0             CONTROL NODE (Current Leader)
traefikee-control-node-2             CONTROL NODE
traefikee-control-node-1             CONTROL NODE
The next section shows another example, but you can already check the traefikeectl ‘s Command Line Reference Documentation to learn more about the operations features.
Deploy an application
TraefikEE is an edge router, which main goal is to route incoming request into your applications.
(A voice in the background): Did you just say “applications”? But there are no applications deployed into this Kubernetes, only TraefikEE.
Containous: Patience, there is an example below. But let that sink in: Isn’t the Dashboard an application with incoming traffic?
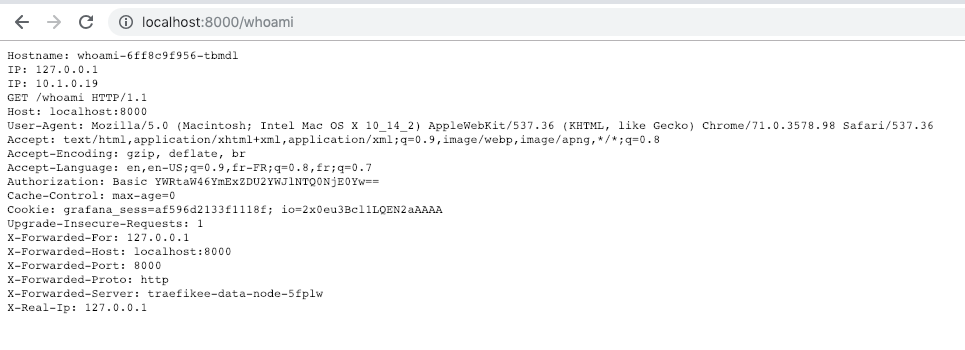
Let’s deploy an example application. It’s an HTTP web service, based on github.com/containous/whoami, which responds an HTML page with the headers of your request.
$ kubectl apply -f https://gist.githubusercontent.com/dduportal/ad5e68ffcd9e39c65bdf4af7224304a0/raw/8b87143b084c612f86d66f587df7c058c7fa1aa0/whoami.yamlCheck the dashboard again. After a few seconds, the routing configuration for the application “whoami” is automatically picked by TraefikEE from Kubernetes: a frontend and 2 associated backends (the 2 replicas).
The application is reachable at the URL localhost:8000/whoami. As the “whoami” application is scaled to 2 instances, try to reload the page multiple time to see the field “Hostname” changing, due to the Load Balancing.
That’s all for today and this first quick tour. On the next post “The Journey to Traefik Enterprise Edition: High Availability”, we’ll cover the distributed features of TraefikEE.


